|
||
|
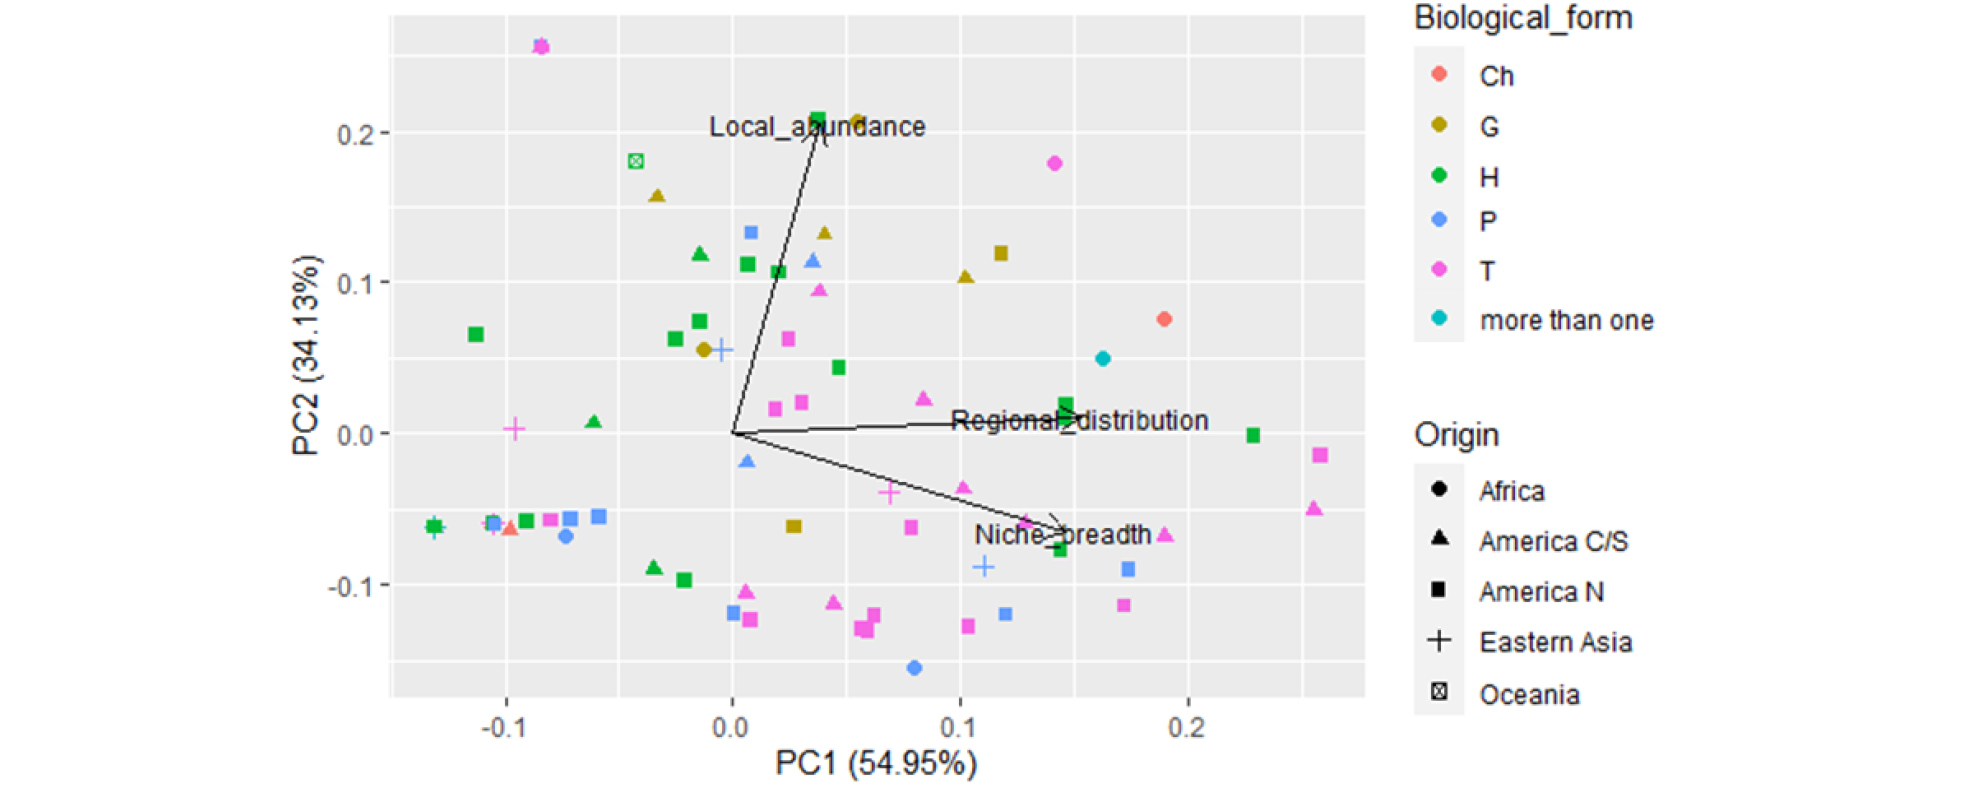
Principal component analysis performed to calculate the synthetic index of invasion success. The scatterplot of alien species is distributed in relation to the three vectors representing the three components of invasion success projected along the first and second components. Ch = chamephyte; G = geophyte; H = Hemicryptophyte; P = phanerophyte; T = therophyte; more than one = species able to exist under more than one life form. Africa = species from Africa (excluding Northern Africa); America C/S = species from Central or South America; America N = species from North America; Eastern Asia = species from Eastern Asia (for example from India, China or Japan); Oceania = species from Australia and surrounding regions. Correlation matrix between variables and axis are showed in appendix S1 of Supporting information. |