|
||
|
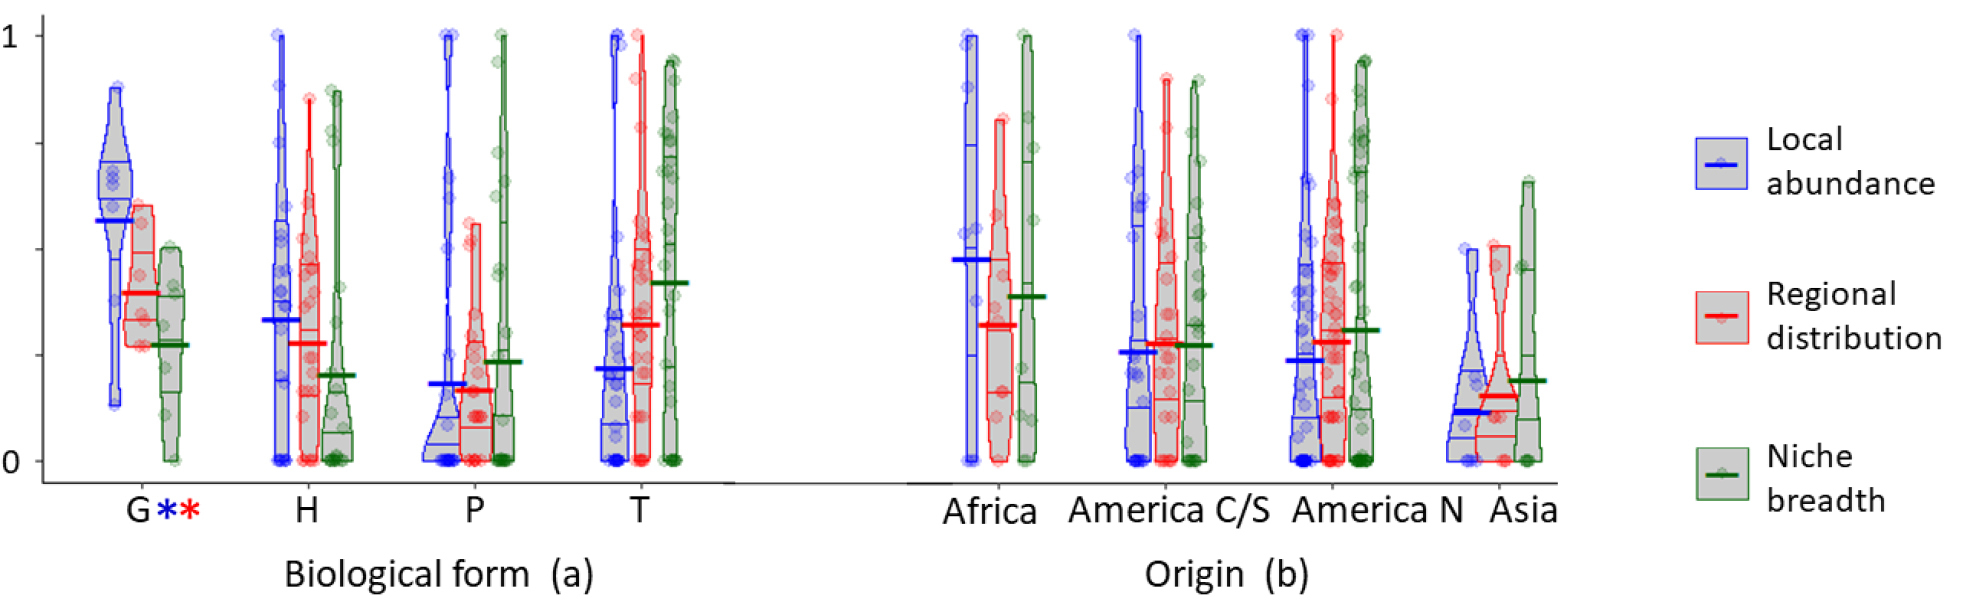
Violin plots of the three components of ecological success related to (a) life forms and (b) species’ origins. Values were rescaled between 0 and 1 (by subtracting the minimum and dividing by the range) for comparability. Bold segment shows the mean and fine segments the quantiles. Asterisks highlight the groups with significantly higher values than other groups according to pairwise Wilcoxon test with Bonferroni correction (Local abundance of G > P, p-value = 0.026; G > T, p-value = 0.041; Regional distribution of G > P, p-value = 0.024). Oceanian origin and chamaephyte group were not represented in these graphs because they included a small number of species (respectively only one and three species). G = geophytes, H = hemicryptophytes, P = phanerophytes, T = therophytes. |