|
||
|
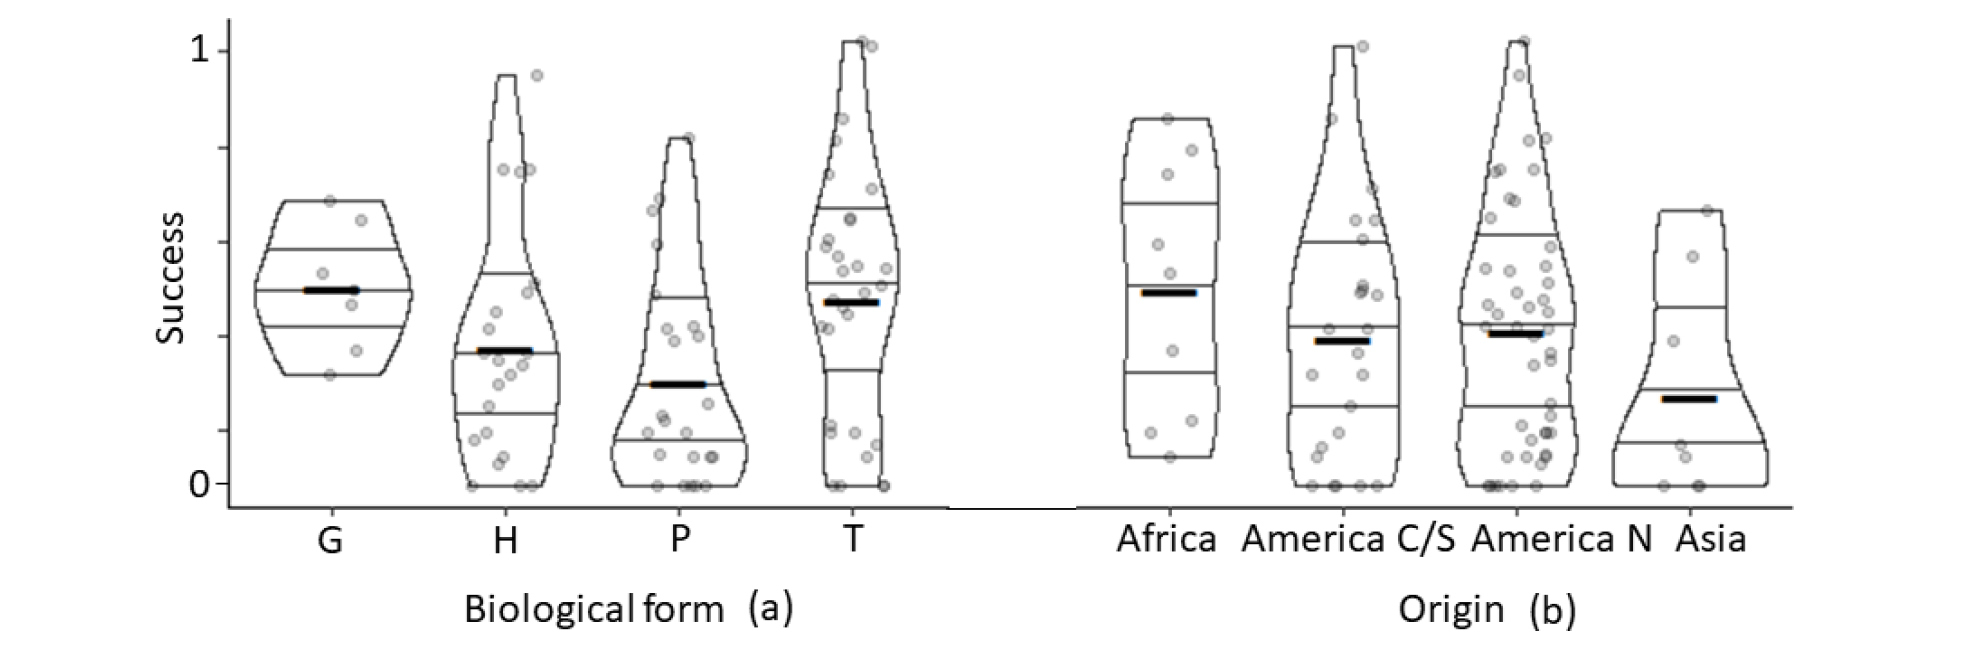
Synthetic index of invasion success, related to (a) life forms and (b) species’ origins. Values are the normalized first component's scores. Bold segment shows the mean and the other segments the quantiles. Oceanian origin and Chamaephyte group were not represented in these graphs because they included a small number of species (respectively only one and three species). G = geophytes, H = hemicryptophytes, P = phanerophytes, T = therophytes. |