|
||
|
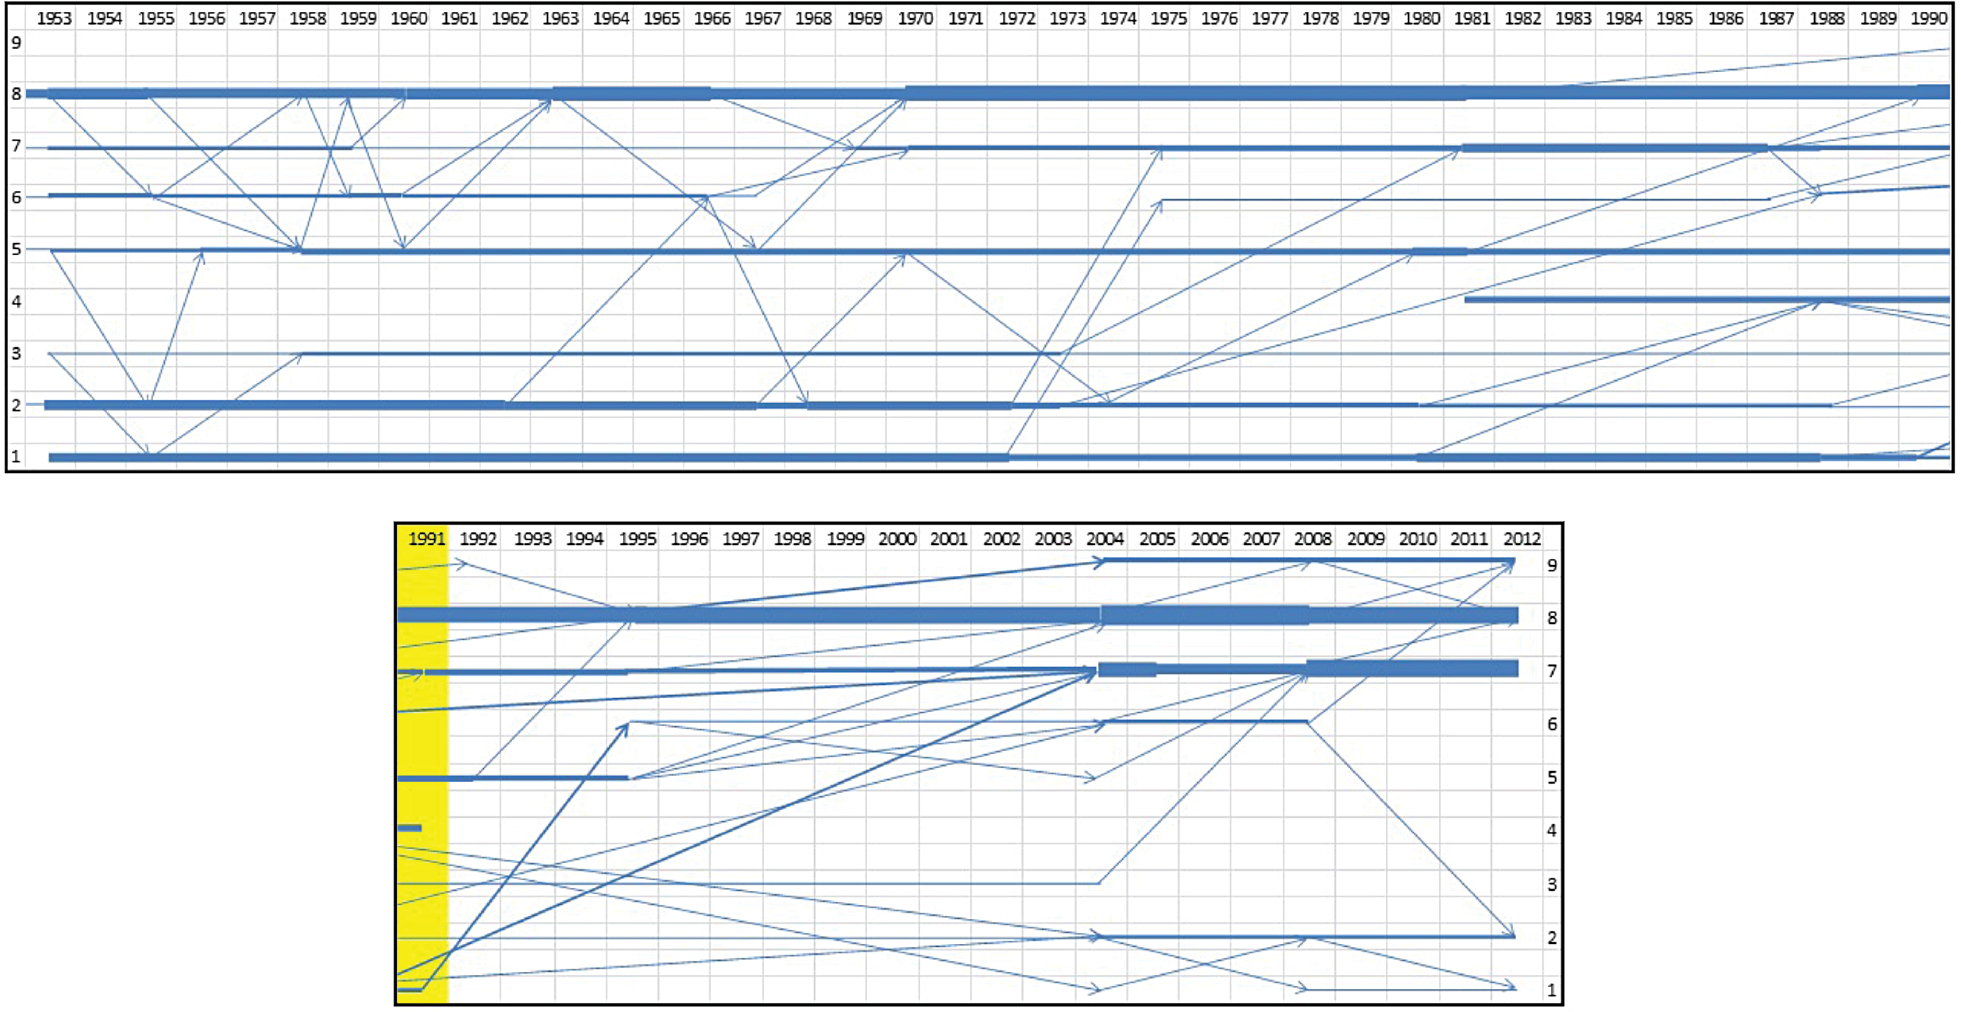
Changes in nine successional stages (Table 1 and Table 2) from 1953 to 2012 based on 32 vegetation clusters of the 41 permanent plots. The thickness of the horizontal lines corresponds with the number of permanent plots in these successional stages; the changes from one to another successional stage are indicated with arrows. The yellow bar represents the start of the livestock grazing. The numbers 1–9 in the left column are explained in Table 2. |